결론부터 말하자면 분석은 된다. 되는데 데이터 리소스를 NCBI로 하는 건 비추다. 왜냐고? 그 이유는 올리면서 말해드림..
def plot_lht_family_tree(alignment_file):
align = AlignIO.read(alignment_file, "fasta")
calculator = DistanceCalculator('identity')
constructor = DistanceTreeConstructor(calculator, 'nj')
tree = constructor.build_tree(align)
fig = plt.figure(figsize=(15, 8))
ax = fig.add_subplot(1, 1, 1)
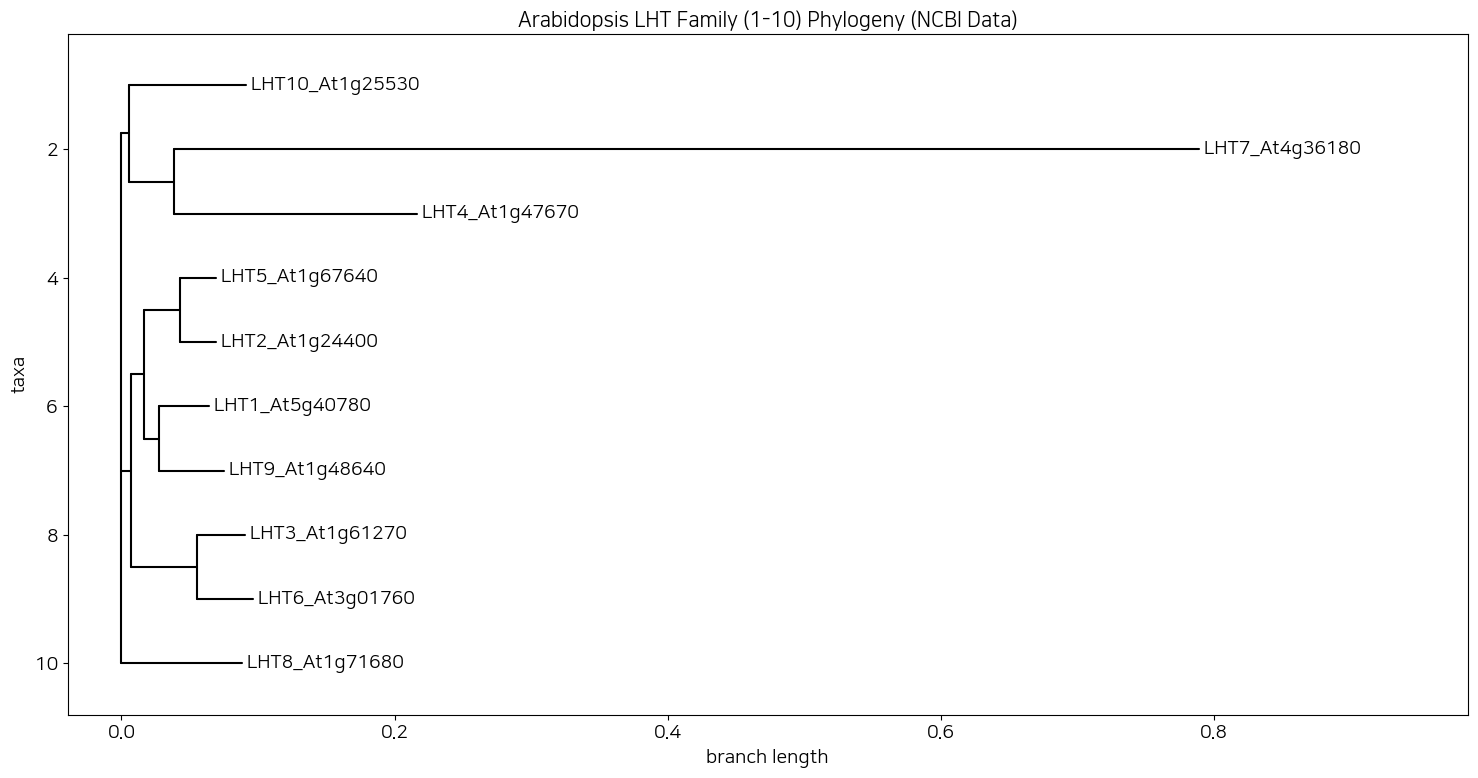
plt.title("Arabidopsis LHT Family (1-10) Phylogeny (NCBI Data)", fontsize=15)
# 연구자님이 설정한 전역 폰트(NanumSquare)가 적용됩니다.
Phylo.draw(tree, axes=ax, do_show=False, label_func=lambda n: str(n) if n.is_terminal() else "")
plt.tight_layout()
plt.show()
plot_lht_family_tree("ARATH_LHT_aligned.aln")
얘가 NCBI에서 유전자 이름으로 찾은거다. 검색한 유전자 이름은 LHT(Lysine/Histidine Transporter) 1.
def plot_flexible_heatmap(alignment_file, target_id):
    """
    alignment_file: MSA 결과 파일 (.aln)
    target_id: 기준이 될 유전자 ID (예: 'LHT1' 또는 'At5g40780')
    """
    align = AlignIO.read(alignment_file, "fasta")

    # 1. 매개변수로 받은 target_id가 포함된 레코드 찾기
    target_idx = -1
    for i, rec in enumerate(align):
        if target_id in rec.id:
            target_idx = i
            break

    if target_idx == -1:
        print(f"❌ 오류: 파일 내에서 '{target_id}'를 찾을 수 없습니다.")
        return

    target_seq = str(align[target_idx].seq)
    names = [rec.id for rec in align]
    identities = []

    # 2. 기준 서열 vs 전체 서열 비교 (Gap-corrected)
    for rec in align:
        curr_seq = str(rec.seq)
        matches = sum(1 for a, b in zip(target_seq, curr_seq) if a == b and a != "-")
        valid_len = sum(1 for a, b in zip(target_seq, curr_seq) if a != "-" and b != "-")

        identity = (matches / valid_len * 100) if valid_len > 0 else 0
        identities.append(identity)

    # 3. 데이터프레임 및 시각화
    df = pd.DataFrame(identities, index=names, columns=[f'Standard: {target_id}'])
    df = df.sort_values(by=df.columns[0], ascending=False)

    plt.figure(figsize=(8, 10))
    sns.heatmap(df, annot=True, fmt=".1f", cmap="Blues")
    plt.title(f"Comparison based on {target_id}")
    plt.tight_layout()
    return df

plot_flexible_heatmap("ARATH_LHT_aligned.aln", "LHT1")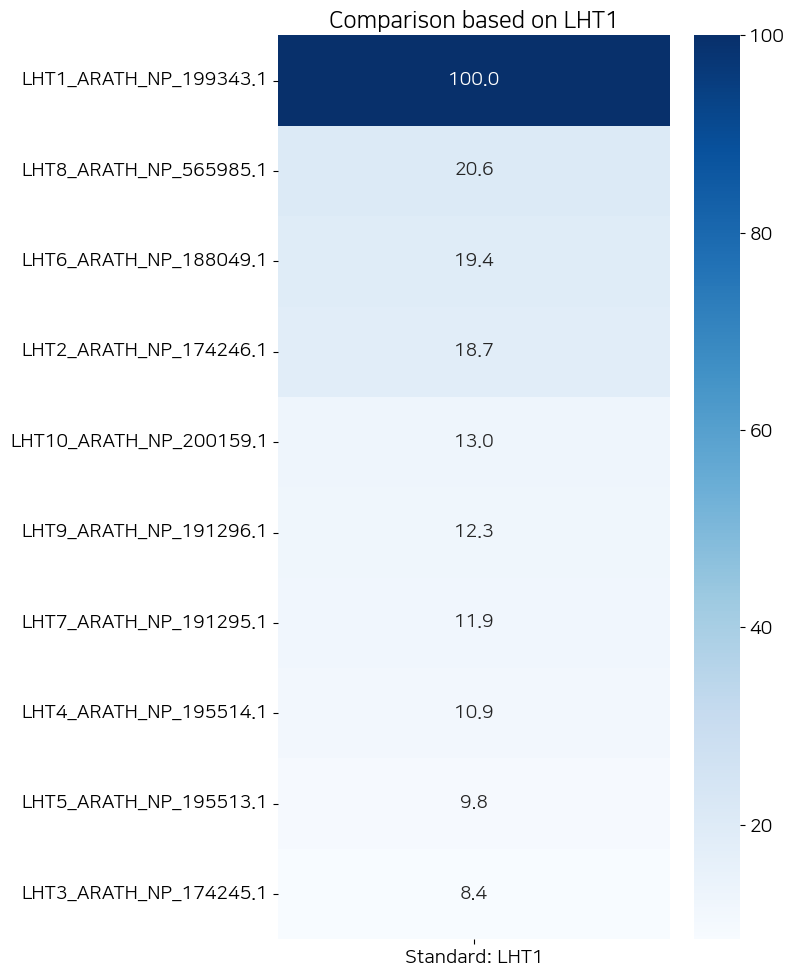
그리고 이건 LHT1과 딸린 식구들의 유사도 히트맵. 이것만 봐서는 뭐가 문제인지 모르시겠죠?

이게 내 논문에 있는 염색체 번호를 바탕으로 다시 그린거다.

많이 다르죠? 오른쪽 히트맵도 본인 논문에 서플로 들어갔던거랑은 좀 다른데 그 정도는 뭐 아 10년동안 연구자들이 규명해서 달라졌구나 할 수 있는 정도거든요? 근데 쟤는 너무 다른거야. 그래서 지피티한테 이게 왜 다른지 물어봤는데, 식물 유전자로 분석할거면 NCBI 말고 식물 전용 DB를 털라고 하더라고. 애기장대면 TAIR라고 있으니까 거기 터십쇼.
[염색체 번호 기준 신원 확인 결과]
Paper_Name  Locus_ID NCBI_Original_Name Match_Status
      LHT1 AT5G40780     ❌ NCBI 리스트에 없음       데이터 누락
      LHT2 AT1G24400     ❌ NCBI 리스트에 없음       데이터 누락
      LHT3 AT1G61270     ❌ NCBI 리스트에 없음       데이터 누락
      LHT4 AT1G47670     ❌ NCBI 리스트에 없음       데이터 누락
      LHT5 AT1G67640     ❌ NCBI 리스트에 없음       데이터 누락
      LHT6 AT3G01760     ❌ NCBI 리스트에 없음       데이터 누락
      LHT7 AT4G36180     ❌ NCBI 리스트에 없음       데이터 누락
      LHT8 AT1G71680     ❌ NCBI 리스트에 없음       데이터 누락
      LHT9 AT1G48640     ❌ NCBI 리스트에 없음       데이터 누락
     LHT10 AT1G25530     ❌ NCBI 리스트에 없음       데이터 누락
봐봐요 염색체로 찾으니까 안나오지.
'Coding > Python' 카테고리의 다른 글
| 코로나바이러스 MSA (0) | 2026.02.05 |
|---|---|
| 라이노바이러스 유전자로 MSA를 해보았다 (0) | 2026.01.27 |
| 매우 주관적인 씨본 컬러맵 고르는 방법 (0) | 2026.01.26 |
| 포켓몬과 이항분포 (0) | 2026.01.21 |
| 데이터프레임의 정보를 확인하는 몇 가지 방법 (0) | 2026.01.08 |